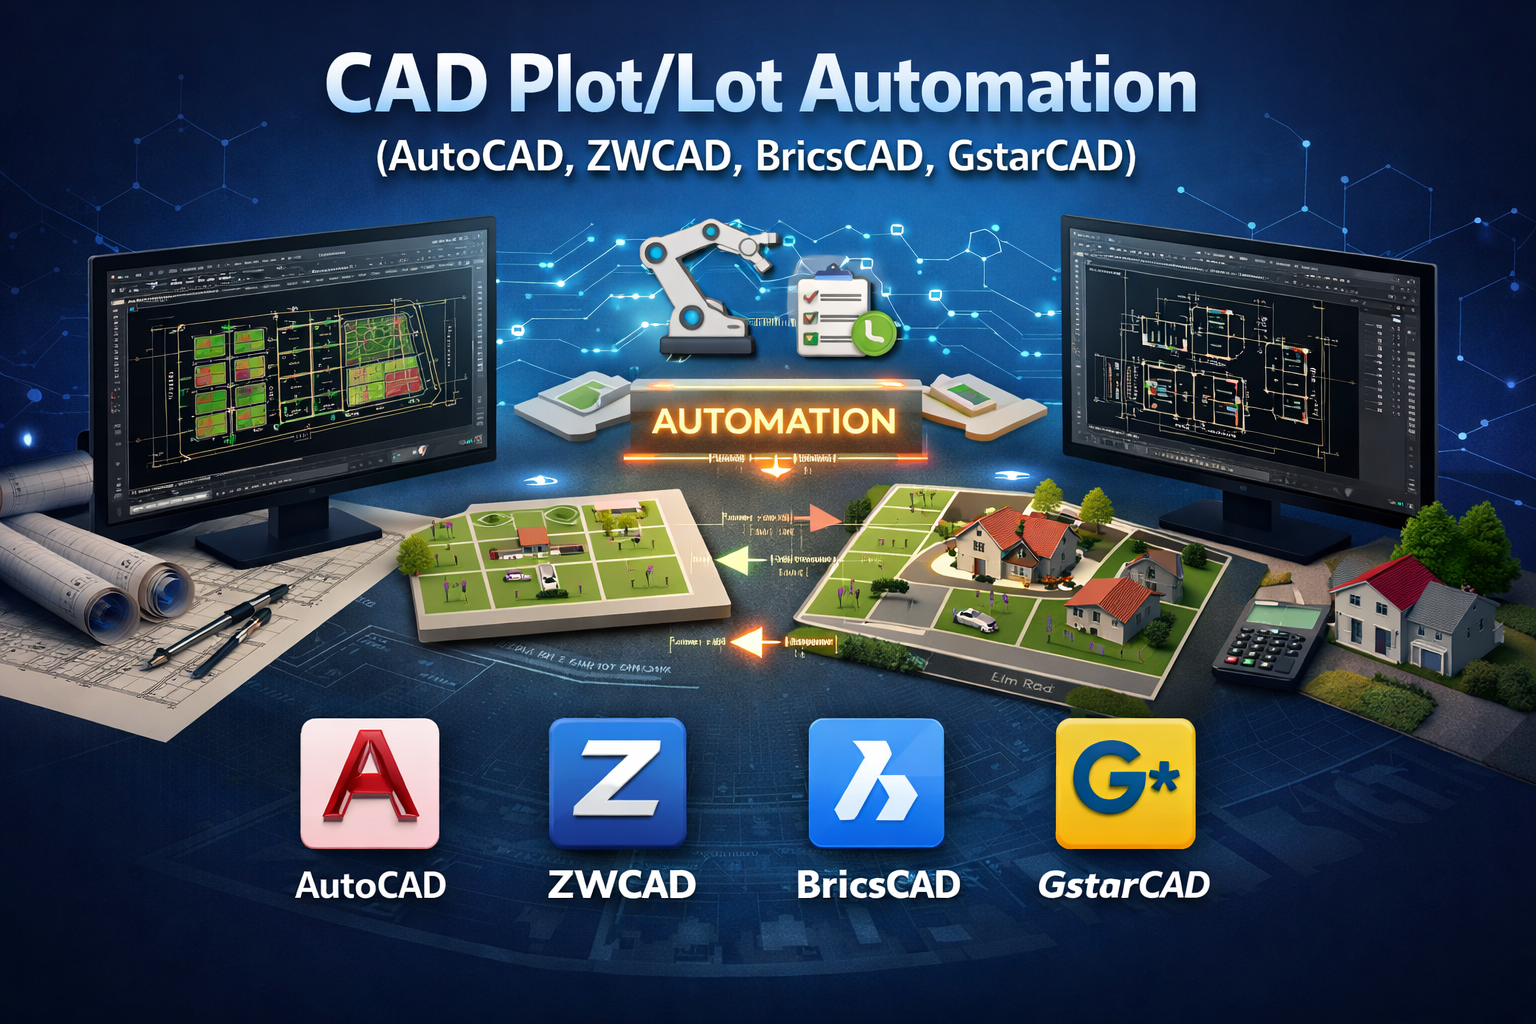
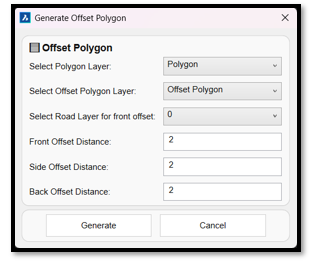
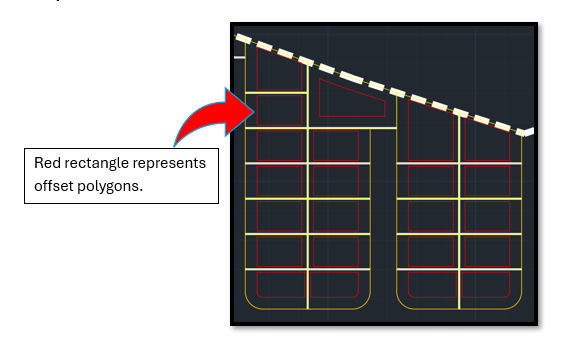
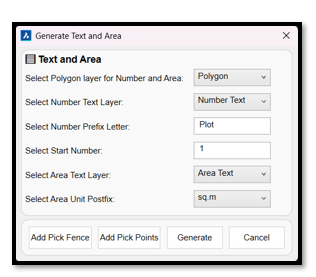
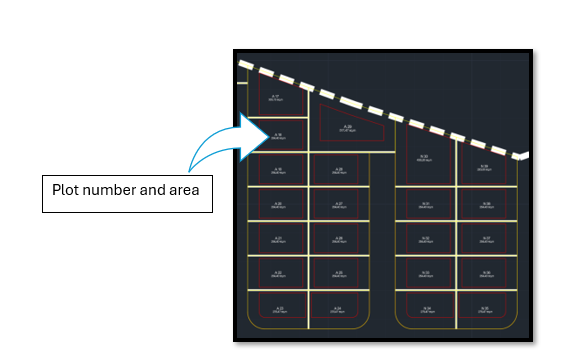
Plot/Lot Automation Using AutoCAD, ZWCAD, BricsCAD & Gstar

Introduction:
The Subdivision Tool is a custom-built AutoCAD plugin developed to automate and standardize the process of plot subdivision, offset generation, labelling, area calculation, visualization, and reporting.
Traditionally, subdivision drafting involves repetitive manual steps, high chances of calculation errors, and significant time consumption when dealing with large layouts. This tool transforms that workflow into a fast, accurate, and intelligent process by combining geometry recognition, layer-based logic, and automated data extraction.
From generating plot polygons to exporting final reports, the Subdivision Tool ensures consistency, precision, and major productivity gains for planners, surveyors, and drafting teams.

Input Drawing:

1. Generate Polygon:

This module automates the creation of plot polygons based on selected plot boundary lines.

Workflow Logic

The system identifies valid plot boundaries from a user-defined Plot Layer and converts closed regions into structured polygon entities on a dedicated Polygon Layer.

Key Features

    • Pick Objects
      Users can select multiple closed areas directly in the drawing. The tool detects valid boundaries and automatically generates polygons inside those regions.
    • Pick Points
      Allows manual generation of individual polygons by clicking inside closed boundary areas.
    • Select Polygon Layer
      Users choose the destination layer where generated polygons will be placed. Predefined layers ensure standardization.
    • Select Plot Layer
      This is the reference layer containing plot boundary lines. Polygon generation depends entirely on this selection.
    • Generate
      Initiates automated polygon creation with a progress bar to indicate real-time processing.
    • Cancel
      Closes the form safely without making changes.

Output:

2. Generate Offset Polygon:

This feature creates offset polygons representing setbacks such as front, side, and rear margins.

Workflow Logic

The tool analyses each polygon’s proximity to road lines and intelligently determines which side is the front, side, or back before applying different offset distances.

Key Features

    • Select Polygon Layer – Source polygons for offsetting
    • Select Offset Polygon Layer – Destination layer for offset polygons
    • Select Road Layer (Front Detection) – Road lines are used to detect the front side of each plot

Offset Controls

    • Generate – Creates all offset polygons with progress tracking
    • Cancel – Closes the form

This eliminates manual trimming and ensures regulation-compliant setback generation.

Output

3.Generate Text & Area:

This module automatically labels each plot with a Plot Number and Area Value.

Workflow Logic

The system calculates polygon areas, applies naming rules, and places text based on orientation defined by user input.

Key Features

    • Polygon Layer Selection – Only selected polygons are processed
    • Number Text Layer – Layer for plot numbering
    • Prefix & Start Number – Custom naming format (e.g., Plot 1, Lot 5)
    • Area Text Layer – Layer for area labels
    • Area Unit Selection – Supports multiple measurement units

Placement Methods

    • Pick Fence
      Users draw a guiding fence line. Text aligns along this direction and is placed only on intersecting plots without overlap.
    • Pick Points
      Users manually place labels inside selected polygons.
    • Generate
      Automatically places non-overlapping, unique plot labels.

This ensures clear, standardized, and professional plot identification.

Output:

4.Generate Hatch:

This feature visually categorizes plots using color-coded hatches based on area ranges.

Workflow Logic

The tool reads polygon areas, compares them against user-defined ranges, and applies corresponding hatch colours.

Key Features

    • Select polygon and hatch layers
    • View minimum and maximum plot areas
    • Add or remove multiple area ranges
    • Assign specific hatch colours per range
    • Apply hatching automatically to matching plots

This makes plot size differentiation instantly visible.

Output:

5.Insert Table:

This module generates structured tables directly inside the drawing.

Workflow Logic

The tool extracts plot numbers, areas, and hatch-based classifications to build organized tables.

Available Tables

    • Plot Table – Lists all plot numbers and areas
    • Range Table – Groups plots based on hatch colour ranges
    • Range Abstract Table – Provides total plots and total area per range, plus grand totals

Additional Controls

    • Table layer selection
    • Custom property prefix for headers
    • Row control for table formatting
    • Automatic alphabetical sorting

This eliminates manual table drafting and calculation errors.

6.Export CSV:

All generated table data can be exported into Excel format.

Workflow Logic

The tool reads plot text, area text, and hatch layers to reconstruct structured data and export it as a spreadsheet.

Export Options

    • Plot Table
    • Range Table
    • Range Abstract Table

Users can define the file location, and the drawing name is used as the default filename.

This allows seamless data sharing with clients, planners, and management teams.

7.Insert Symbol:

This module allows users to insert, edit, delete, search, and modify block and add new DWG file symbols dynamically from a predefined DWG library.

Background Block Library

    • When the plugin loads, a DWG file containing all standard blocks (Chambers, Arrows, etc.) loads automatically.

    • All blocks are displayed in the UI as cards.

    • Each card shows:

      • Block preview image

      • Block name

      • Insert, Edit, and Delete buttons

Search Feature

    • A search bar allows users to search blocks by name.

    • Matching blocks are displayed instantly.

Block Operations

# Insert

    • User selects an alignment (polyline).

    • User picks a point on it.

    • Block is inserted at that point and aligned to the polyline direction.

# Edit

    • Opens the block in Block Editor.

    • After saving and closing, changes are updated in the background drawing.

# Delete

    • Removes the block from the UI list (temporary).

    • Does not delete the block from the background drawing.

# Add New File

    • User can browse and select a new DWG file.

    • All blocks from that file are loaded.

    • User can rename blocks if needed.

    • Clicking Add displays them in the UI.

Modify Symbols

# Select Symbols

    • User selects multiple blocks in drawing.

    • Selected count is shown in UI.

# Replace

    • Selected blocks are replaced with a chosen block from UI.

# Rotate

    • User selects 90°, 180°, or 270°.

    • Selected blocks rotate accordingly.

# Flip

    • User selects Flip X or Flip Y.

    • Then selects a line in drawing.

    • Blocks are mirrored based on that line.

Cancel

    • Closes the Insert Symbol window.

Conclusion:

The Subdivision Tool transforms a traditionally manual drafting process into an intelligent, automated workflow. By integrating geometry processing, layer logic, and reporting capabilities, the tool delivers speed, accuracy, and consistency across subdivision projects.

By leveraging automation, users can:

    • Reduce drafting time significantly
    • Eliminate manual area calculation errors
    • Maintain consistent layering and standards
    • Instantly generate visual and tabular reports
    • Improve clarity in large-scale layout projects

Utility Highlights

✔ Smart polygon recognition
✔ Road-based offset intelligence
✔ Automatic plot numbering & area labelling
✔ Range-based hatch visualization
✔ Instant drawing tables
✔ One-click Excel export
✔ Adding symbols in selected alignment with effective features.

Demo Video:

Author: Rutik Gurav

If you have a project in mind or need further assistance with this tool. Please contact us at [email protected]

Leave a Comment

Your email address will not be published. Required fields are marked *


This will close in 0 seconds